News Story
Data fusion modeling can estimate residential radon levels
ISR-affiliated Professor Benjamin Kedem (Mathematics), his Ph.D. student Xuze Zhang, and Saumyadipta Pyne of the University of Pittsburgh School of Public Health have proposed a data fusion method for estimating residential radon level distribution in geographic areas where exposure to underground radon may be an issue.
Radon (specifically Radon-222), is a tasteless, colorless and odorless radioactive gas. It is a product of Uranium-238 and Radium-226, both of which are naturally abundant in the soil, particularly in certain geologic regions. Radon is known worldwide as a carcinogen, as its inhaled decay products can get trapped in the lungs and induce DNA mutations. Exposure to radon is the leading cause of lung cancer among non-smokers. In regions with high concentrations of radon, it is both an occupational hazard to miners and a serious risk factor for the general population, who are exposed to the gas in their residences via cracks in basement floors, walls, and so on. In these regions, homeowners are encouraged to outfit their basements with radon detectors and sometimes special mitigating ventilation systems. The presence of radon can affect real estate values.
The paper Estimation of Residential Radon Concentration in Pennsylvania Counties by Data Fusion shows how to estimate the radon concentration distribution in a county of interest by combining or fusing the county’s radon data with data from its neighboring counties, using the so-called density ratio model (DRM) with an extension of variable tilts. Such flexibility is a new feature that mitigates the problem of misspecified DRM.
In the paper, Beaver County in western Pennsylvania, and its four immediate neighbors, are taken as a case in point. The distribution of radon concentration is estimated in each of six periods, and then the analysis is repeated, combining the data from all the periods to obtain estimates of threshold probabilities and the corresponding confidence intervals.
The authors follow a two-stage procedure. First, they estimate the radon concentration distribution for each reference county for each period by DRM, using combined data from the reference county and its neighbors. If the radon distributions in each of the six periods behave similarly, the authors proceed next to combine the data from the different periods and use the DRM again to get an improved estimate of the radon concentration distribution for the reference county. If the radon distributions in each of the six periods behave differently, the results from the last period only are used.
The results are useful for public health policy and real estate property appraisal.
Published January 8, 2020
Related Stories
Stories / January 10, 2022
AR framework can model rare dynamic phenomena and extreme events
Stories / July 23, 2020
Radon estimation model is featured as Wiley 'Layman's Abstract'
Stories / November 30, 2023
Martins, Arcak and Park organize 'population games' workshop at...
Stories / November 29, 2023
Andrew Newman’s risk-taking work leads to Data Fusion Award
Stories / November 15, 2023
Reinforcement learning is a game for Kaiqing Zhang

Stories / September 7, 2023
Oct. 13-14: Workshop on New Frontiers in Networked Dynamical...
Stories / August 10, 2023
UMD papers by Zhang, Manocha groups at ICML 2023
Stories / June 20, 2023
Xuze Zhang wins outstanding graduate student award from the...
Stories / April 26, 2023
A new epidemiology model based on game theory
Stories / March 31, 2023
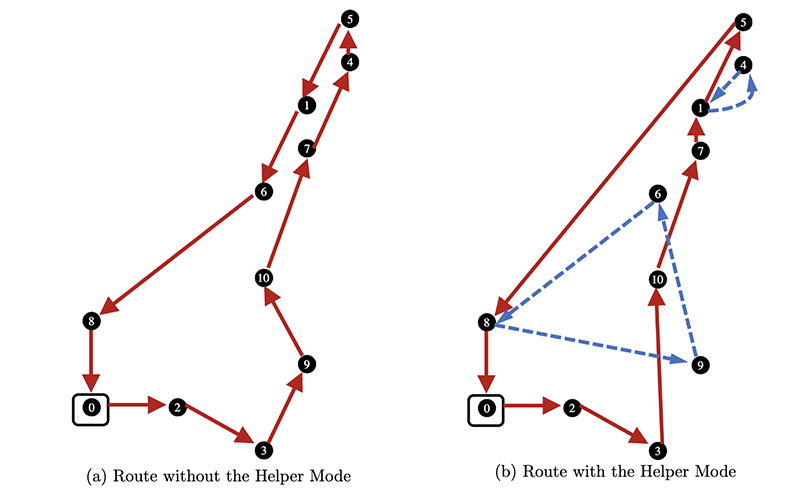
When does a package delivery company benefit from having two...