News Story
AR framework can model rare dynamic phenomena and extreme events
The ability to augment real-world observations with virtual information is transforming engineering, health care and artificial intelligence. Combining real and synthetic data produces augmented reality (AR), which opens up new perspectives regarding statistical inference. Powerful technologies are emerging in robotics, the Internet of Things, and “digital twins”—advanced models that simulate complex real-world physical networks like city sewer and subway systems.
Using an AR framework they have developed over the last few years, ISR-affiliated Professor Benjamin Kedem (Math) and his co-authors have written a new paper, Augmented Reality: A Computational Framework Applied to Modeling the Dynamics of Air Pollution. The work models the drastic drop in air pollution levels in Washington, D.C. in 2020, due to the COVID-19 lockdown.
In addition to Kedem, the paper was written by Saumyadipta Pyne of the Health Analytics Network, LLC, in Pittsburgh, Pa., and Ryan Stauffer of the Atmospheric Chemistry and Dynamics Lab at the NASA Goddard Space Flight Center. It was presented at the 23rd Annual Conference (2021) of the Society of Statistics, Computer and Applications and has been published in its Special Proceedings.
The authors’ AR framework combines real data with computer-generated synthetic samples to “look under the hood” and gain insights into rare, dynamic phenomena. Using data fusion and a density ratio model, the framework allows the researchers to estimate the tail probabilities of exceeding large thresholds that are far beyond the limited range of observations in moderately sized data. Such thresholds represent extreme events such as the 2020 air pollution drop.
The computationally intensive approach repeats AR in the estimation of very small tail probabilities even from moderately sized samples, and looks repeatedly outside the sample. Synthesizing a given sample of real world observations repeatedly with computer-generated data is based on the repeated out-of-sample fusion. This strategy is useful for inference in surveillance applications where available datasets usually have a limited range of observations and a moderate size due to limited storage capacity.
This AR approach allows Kedem and his colleagues to model phenomena of sudden yet significant change, and could be useful in predicting stock market crashes, disease outbreaks, and extreme climatic events. The sudden 10-percent drop in greenhouse gas emissions from energy and industry in 2020 is a prime example. Due to the pandemic, emissions fell to their lowest levels in at least three decades. In particular, as millions of people stopped driving to work, emissions from transportation fell by 14.7 percent.
Using nitrogen dioxide (NO2) levels as an indicator of traffic volume at a given area over a given interval of time, the authors used their AR framework to model the dynamics of air pollution for the Washington, D.C. area for three months before and after a stay-at-home order went into effect on April 1, 2020.
They tested for similarity in the levels of NO2 in the morning air in the two periods by using their respective probability distributions. This was done by fusing data from the two periods. Then they estimated the tail probability of NO2 level exceeding T = 100 parts per billion (ppb) in each of the two periods by repeatedly fusing the data with computer generated samples.
The study demonstrates how the repeated AR approach could provide a computational framework for modeling the dynamics of air pollution due to traffic emissions during a period of sudden, sharp change.
The approach is expected to become more feasible as new, powerful computational platforms such as generative adversarial networks (GANs) are developed. The availability and reliability of computer-generated samples that are representative of real data should increase, allowing for easier data augmentation.
Published January 10, 2022
Related Stories
Stories / July 23, 2020
Radon estimation model is featured as Wiley 'Layman's Abstract'

Stories / January 8, 2020
Data fusion modeling can estimate residential radon levels
Stories / June 20, 2023
Xuze Zhang wins outstanding graduate student award from the...

Stories / May 26, 2021
ISR faculty leading, playing key roles in ARL cooperative...
Stories / November 30, 2023
Martins, Arcak and Park organize 'population games' workshop at...
Stories / November 29, 2023
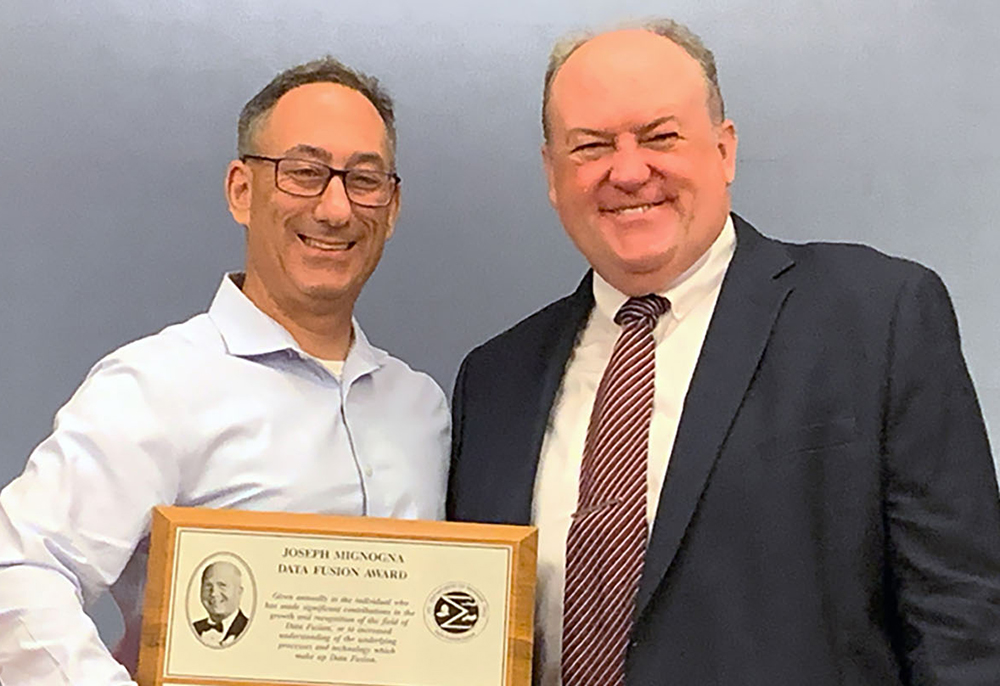
Andrew Newman’s risk-taking work leads to Data Fusion Award
Stories / November 15, 2023
Reinforcement learning is a game for Kaiqing Zhang

Stories / September 7, 2023
Oct. 13-14: Workshop on New Frontiers in Networked Dynamical...
Stories / August 10, 2023
UMD papers by Zhang, Manocha groups at ICML 2023
Stories / April 26, 2023
A new epidemiology model based on game theory