News Story
Treemap Art Project showcases Shneiderman's work in a new light
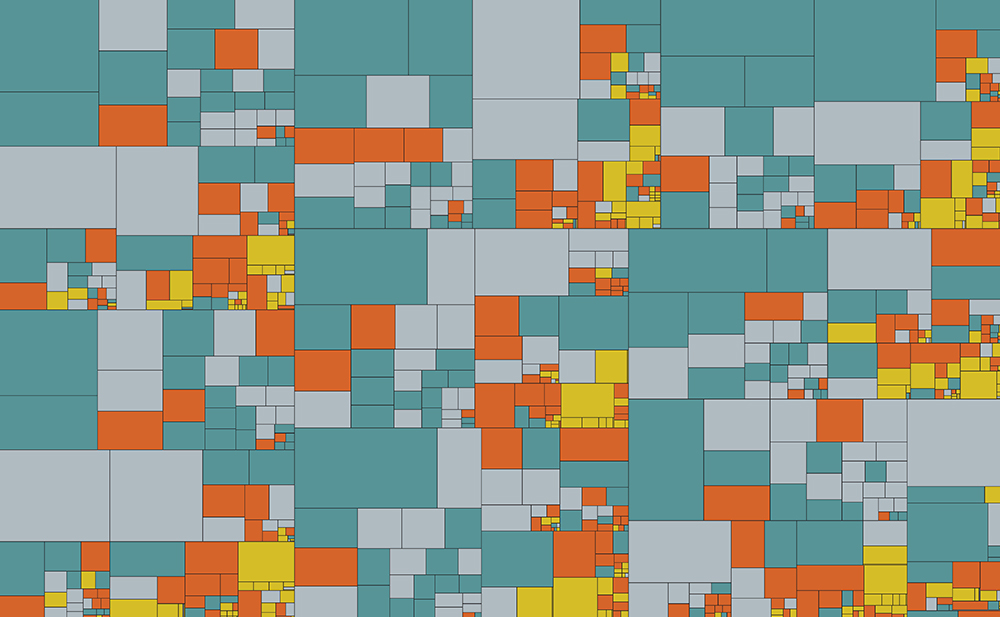
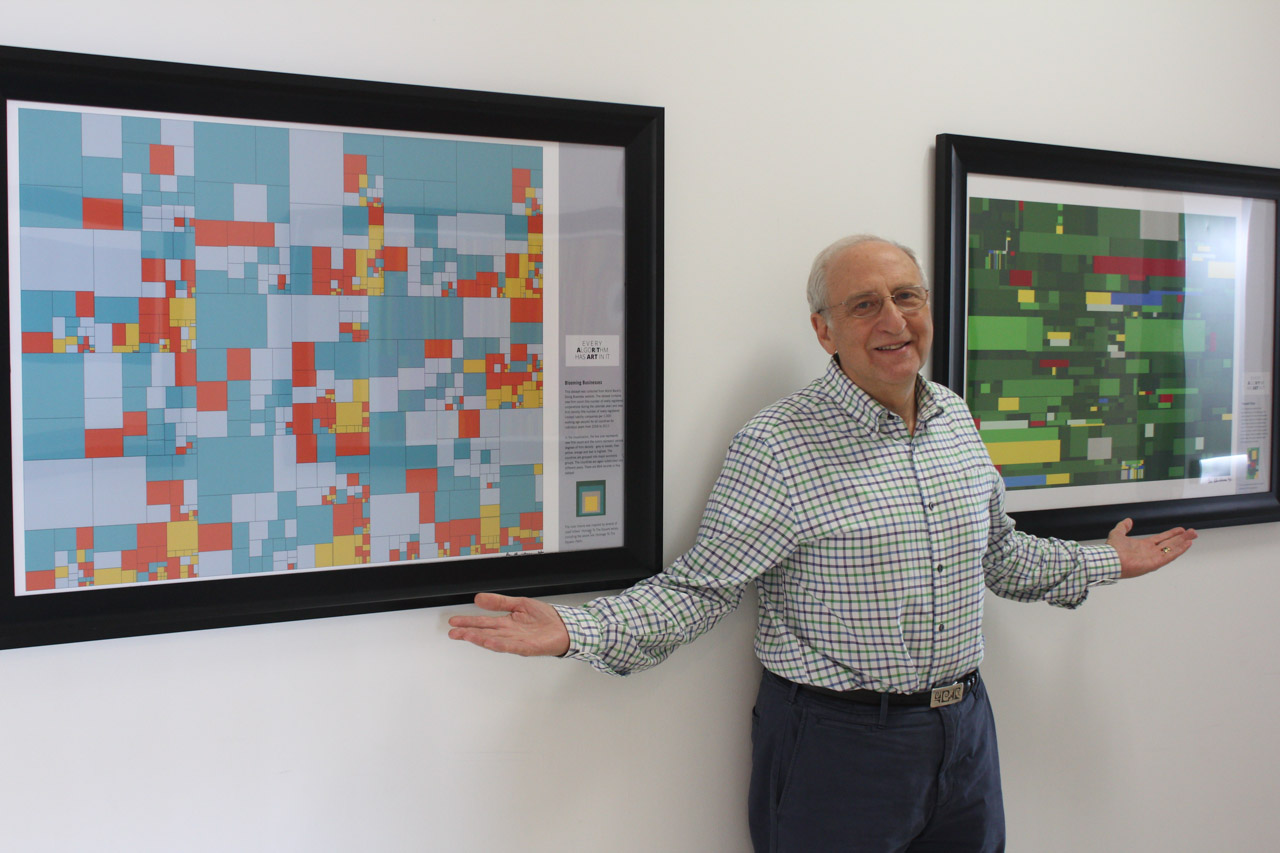
The color theme for this treemap, "Blooming Businesses," was inspired by several works in Josef Albers' "Homage To The Square" series. The dataset was collected from the World Bank's Doing Business website. The dataset contains new firm count (the number of newly registered corporations during the calendar year) and new firm density (the number of newly registered limited liability companies per 1,000 working-age people) for all countries for individual years from 2004 to 2011. In the visualization, the box size represents new firm count and the colors represent various degrees of firm density--grey is lowest, then yellow, orange and teal is highest. The countries are grouped into major economic groups. The countries are again subdivided into different years. There are 864 records in this dataset.
[Click the picture for a larger view.]
A new art exhibit on the third floor of the University of Maryland Computer Science Instructional Center (CSIC) focuses on the treemaps work of ISR-affiliated Professor Ben Shneiderman (CS/UMIACS).
The Treemap Art Project shows the aesthetic aspects of the treemaps hierarchical data visualization tool developed in the Human Computer Interaction Lab beginning in 1990. The software tool to produce treemaps is free to download and use.
Although Shneiderman developed treemaps for purely functional purposes, he was always aware that the tool produced appealing aesthetic aspects. "Maybe my experiences with OP-ART movements of the 60s & 70s gave me the idea that a treemap might become a work of art," Shneiderman says.
He believes there are at least four aesthetic aspects of treemaps: layout design (slice-and-dice, squarified, ordered, strip, etc.); color palette (muted, bold, sequential, divergent, rainbow, etc.); aspect ratio of the entire image (square, golden ratio, wide, tall, etc.); and the prominence of borders for each region, each hierarchy level, and the surrounding box.
In addition, Shneiderman says, certain treemaps are inherently interesting because of the data displayed or patterns revealed. The aesthetic choices and the data displayed appeal to different viewers. So even though treemaps are constrained by algorithmic rules, the aesthetic and data choices leave much room for creative explorations. Colored rectangular regions, such as treemaps produce, were a popular theme in 20th century art, most notably in the work of Piet Mondrian, whose work has a close affinity with treemaps. The Washington Color School's Gene Davis produced large horizontal paintings with vertical stripes of many colors; it is easy to generate treemap layouts in this style. The rectangles in Josef Albers "Homage to the Square" or Mark Rothko's imposing paintings are not treemaps, but generating treemap variants triggered further artistic explorations.
Other modern artists such as Kenneth Noland, Barnett Newman, and Hans Hofmann gave further provocations to the images in this collection. The exhibit was made possible by the University of Maryland Computer Science Department and the Institute for Advanced Computer Studies (UMIACS).
| View the treemaps featured in the exhibition at the Treemap Art Project website |
Published September 4, 2013
Related Stories
Stories / October 18, 2021
Shneiderman, Bederson, Wattenberg to receive IEEE VIS Test of...
Stories / March 1, 2021
Ben Shneiderman video talk on human-centered AI now available

Stories / November 8, 2019
Shneiderman, Varshney inducted into IEEE Visualization Academy
Stories / August 2, 2018
Shneiderman to speak at Arena Civil Dialogue, Aug. 12
Stories / July 28, 2018
Shneiderman receives honorary doctorate from Swansea University

Stories / March 17, 2016
New book by Ben Shneiderman promotes integrated research...

Stories / March 1, 2016
NAI Fellows' names read into the Congressional Record
Stories / December 15, 2015
Baras, Shneiderman named Fellows of the National Academy of...
Stories / October 3, 2014
Shneiderman art exhibition at National Academies opens Oct. 16
Stories / November 22, 2013
Shneiderman, Plaisant win Distinguished Paper Award at AMIA...