Simulation is a very useful tool for predicting supply chain performance. Because there are no standard simulation elements that represent accurately the activities in a supply chain, there exist a variety of approaches for developing supply chain simulation models. To improve this situation, this project describes a supply chain simulation framework that follows the Supply Chain Operations Reference (SCOR) model. This framework has been used for building simulation models that integrate discrete event simulation and spreadsheets. The simulation models are hierarchical and use submodels that capture activities specific to supply chains. The SCOR framework provides a basis for defining the level of detail in a way as to include as many features as possible, while not making them industry specific. This approach enables the reuse of submodels, which reduces development time.
Demo Supply Chain
The supply chain simulation framework has
been built using Arena and Microsoft Excel. These two applications communicate
using Visual Basic. In the folder ‘Demo_Model’, you will find the Arena model and Excel
file that demonstrate the hierarchical modeling approach to building supply
chain models using SCOR. The demo model has four suppliers, one manufacturer,
one warehouse, two retailers, and two customers. The following section gives
the details of the simulation model.
The model is built in Arena using Arena 5.0
Professional Version. To run the model, download the Arena file and the
accompanying Excel files to a local folder. Open the Arena file and have
Microsoft Excel application open on the PC. The model currently runs for a
period of 80 days, and ten replications.These parameters can be changed in the
Run->Settings option of Arena.
Control logic for the VBA blocks in Arena can
be found in the ThisDocument section of Arena VB editor. Similarly, Excel files
also have corresponding VB macros and procedures.
For further information on the project,
please refer to
http://techreports.isr.umd.edu/TechReports/ISR/2002/MS_2002-9/MS_2002-9.phtml.
Description of Supply Chain
Supply
Chain Structure
The supply chain has ten participants: four suppliers, one manufacturer, one warehouse, two retailers, and two customers. The manufacturer produces three kinds of products: Product 1, Product 2, and Product 3. Each customer places orders for all the products with the retailer. Each unit of Product 1 consists of one unit of Component 1 and one unit of Component 2. Each unit of Product 2 consists of one unit of Component 1 and one unit of Component 3. Each unit of Product 3 consists of one unit of Component 1 and one unit of Component 4. Supplier 1 supplies Component 1, Supplier 2 supplies Component 2, Supplier 3 supplies Component 3, and Supplier 4 supplies Component 4. Figure 1 shows a schematic of the supply chain. Figure 2 represents the bill of material for the three products that the Manufacturer 1 produces.
Product 1 represents a high demand product, and hence is stocked by the retailer. When a customer places orders for this kind of product, the retailer supplies the product immediately provided it is in stock. For product 2, the demand is intermediate. So, the retailer does not stock this product. When a customer places an order with the retailer, the retailer in turn places an order with the warehouse. The warehouse stocks this kind of product and it delivers the product to the retailer, who in turn delivers it to the end customer. For products of type 3, the demand is very low. So neither the retailer, nor the warehouse keeps any inventory for this product. When a customer places an order with the retailer for this kind of product, this is passed directly to the manufacturer and the manufacturer delivers the product to the retailer through the warehouse. The retailer then delivers it to the customer.
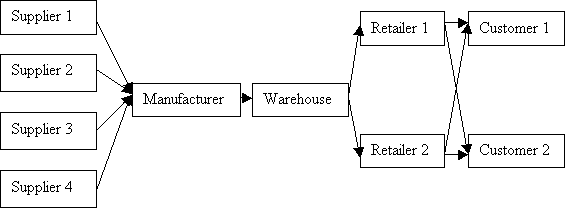
Figure 1. Supply Chain Network
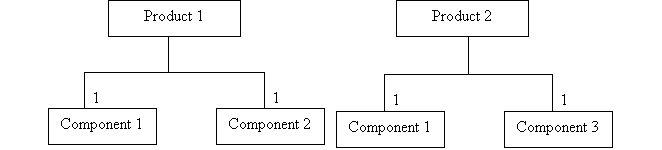
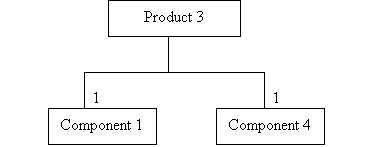
Figure 2. Bill of Materials for
Manufacturer 1
The demands and order intervals from the customer follow a distribution with mean and squared coefficient of variance as shown in Table 1.
|
Customer |
Retailer |
Product |
Demand |
Inter-arrival Time |
||
|
Mean (Parts / Order) |
Distribution |
SCV |
||||
|
Customer 1 |
Retailer 1 |
Product 1 |
100 |
Constant |
8 |
0 |
|
Customer 1 |
Retailer 1 |
Product 2 |
50 |
Constant |
24 |
0 |
|
Customer 1 |
Retailer 1 |
Product 3 |
25 |
Constant |
48 |
0 |
|
Customer 1 |
Retailer 2 |
Product 1 |
50 |
Poisson |
24 |
1 |
|
Customer 1 |
Retailer 2 |
Product 2 |
20 |
Poisson |
48 |
1 |
|
Customer 1 |
Retailer 2 |
Product 3 |
10 |
Poisson |
96 |
1 |
|
Customer 2 |
Retailer 1 |
Product 1 |
300 |
Poisson |
24 |
0.5 |
|
Customer 2 |
Retailer 1 |
Product 2 |
50 |
Poisson |
24 |
0.5 |
|
Customer 2 |
Retailer 1 |
Product 3 |
40 |
Poisson |
72 |
0.5 |
|
Customer 2 |
Retailer 2 |
Product 1 |
50 |
Poisson |
48 |
2 |
|
Customer 2 |
Retailer 2 |
Product 2 |
20 |
Poisson |
48 |
2 |
|
Customer 2 |
Retailer 2 |
Product 3 |
10 |
Poisson |
96 |
2 |
Inventory
Management
Inventory management is carried out based on a (R, s, S) policy. Table 2 shows the reorder levels and order up to quantities of the participants of the supply chain. This work follows an iterative approach for setting the reorder level. We set the reorder levels taking into account the variability in the demand for the product, the variability in the lead time of the supplier, and delay due to periodic rather than continuous review (Silver et al, 1998). We set the order up to quantity equal to the reorder level. The following equation is used for calculating the reorder levels:
![]()
s = Reorder level
a = Sourcing rescheduling period
b = Factor to take into account the variability in lead time and demand
(safety stock)
CT = Supplier’s cycle time for the product in days
D = Average demand for the product per day
In the equation, a = 3 days (72 hours) is the maximum rescheduling period in the set of simulation runs. We multiply the cycle time by a factor of two (b=2) in order to take in to account the variability in demand and the supplier’s lead time.
The values for the inventory levels are fixed iteratively. Initially, the inventory levels for all the participants are set equal to the quantity sufficient to meet the demands for one week. We start at the suppliers, who are the most upstream participants in the supply chain. Based on the cycle time for the suppliers, the inventory levels for the manufacturer are set. These values are used for the next iteration. During each iteration, after setting the inventory level for an upstream participant, we carry out a new round of simulation to check the cycle time performance with the new inventory levels and based on those values, the inventory levels for the corresponding downstream participant(s) is (are) set. We repeat this process till all the inventory levels have been established. The cycle time values obtained during these simulation runs are used to set the lead times for products at various participants. The final values for inventory reorder level are given in Table 2.
|
Participant |
Product |
Reorder Level (s) |
Order Up To (S) |
|
Retailer 1 |
Product 1 |
4800 |
4932 |
|
Retailer 1 |
Product 2 |
0 |
0 |
|
Retailer 1 |
Product 3 |
0 |
0 |
|
Retailer 2 |
Product 1 |
600 |
617 |
|
Retailer 2 |
Product 2 |
0 |
0 |
|
Retailer 2 |
Product 3 |
0 |
0 |
|
Warehouse |
Product 1 |
10125 |
9680 |
|
Warehouse |
Product 2 |
1800 |
1721 |
|
Warehouse |
Product 3 |
0 |
0 |
|
Manufacturer |
Component 1 |
7433 |
6904 |
|
Manufacturer |
Component 2 |
6075 |
5900 |
|
Component 3 |
960 |
946 |
|
|
Manufacturer |
Component 4 |
247 |
241 |
Table
2. Reorder Levels and Order Up To Quantities
Processing
Times
The processing times at the suppliers are given in Table 3. The processing times given correspond to the average values. Processing times are exponentially distributed. For Release and Produce activities, the processing times given are per part. For all the other processing times, the values are per order. Processing times at the manufacturer are given in Table 4. Table 5 gives the processing times at the warehouse and the retailers. Mean delivery times between the participants of the supply chain are given in Table 6. Delivery times are exponentially distributed.
|
Raw Material |
Release |
Produce |
Pack |
Stage
|
|
Component 1 |
0.1 |
1 |
15 |
15 |
|
Component 2 |
0.1 |
1 |
15 |
15 |
|
Component 3 |
0.1 |
1 |
15 |
15 |
|
Component 4 |
0.1 |
1 |
15 |
15 |
Table 3. Processing Times at Suppliers (Mins)
|
Raw Material / Product |
Receive |
Verify |
Transfer |
Release |
Produce |
Pack |
Stage
|
|
Component 1 |
15 |
15 |
15 |
|
|
|
|
|
Component 2 |
15 |
15 |
15 |
|
|
|
|
|
Component 3 |
15 |
15 |
15 |
|
|
|
|
|
Component 4 |
15 |
15 |
15 |
|
|
|
|
|
Product 1 |
|
|
|
1 |
15 |
15 |
15 |
|
Product 2 |
|
|
|
1 |
15 |
15 |
15 |
|
Product 3 |
|
|
|
1 |
15 |
15 |
15 |
Table 4. Processing Times at Manufacturer (Mins)
|
Product |
Receive |
Verify |
Transfer |
Release |
Pack |
Stage |
|
Product 1 |
15 |
15 |
15 |
1 |
15 |
15 |
|
Product 2 |
15 |
15 |
15 |
1 |
15 |
15 |
|
Product 3 |
15 |
15 |
15 |
1 |
15 |
15 |
Table 5. Processing Times at Warehouse and Retailers
(Mins)
|
From |
To |
Time (hours) |
|
Supplier 1 |
Manufacturer |
10 |
|
Supplier 2 |
Manufacturer |
8 |
|
Supplier 3 |
Manufacturer |
9 |
|
Supplier 4 |
Manufacturer |
10 |
|
Manufacturer |
Warehouse |
6 |
|
Warehouse |
Retailer 1 |
6 |
|
Warehouse |
Retailer 2 |
7 |
|
Retailer 1 |
Customer 1 |
4 |
|
Retailer 1 |
Customer 2 |
6 |
|
Retailer 2 |
Customer 1 |
8 |
|
Retailer 2 |
Customer 2 |
9 |
Table 6. Mean Delivery Times (hours)
Server
Capacities
The total processing time, and hence the required server capacity, depends on the number of parts for the Release Material stage and Produce stage. For all the other stages, this value depends on the number of orders and not on the order size. Since the number of orders at the warehouse, the manufacturer, and the suppliers depend on the inventory policies of their customers, one cannot estimate it with great accuracy. We have calculated the capacities wherever it is possible to calculate it with the available information. The expected utilization is set at around 85%. For all the other resources, we adjust the capacities during the pilot runs by analyzing the corresponding resource utilization and cycle time values. Table 7, 8, and 9 give the resource capacities at various participants.
Participant |
Stage |
Capacity (Number of servers) |
|
Supplier 1 |
Release |
1 |
|
Supplier 1 |
Produce |
2 |
|
Supplier 1 |
Package |
1 |
|
Supplier 1 |
Stage |
1 |
|
Supplier 1 |
Deliver |
5 |
|
Supplier 2 |
Release |
1 |
|
Supplier 2 |
Produce |
2 |
|
Supplier 2 |
Package |
1 |
|
Supplier 2 |
Stage |
1 |
|
Supplier 2 |
Deliver |
5 |
|
Supplier 3 |
Release |
1 |
|
Supplier 3 |
Produce |
1 |
|
Supplier 3 |
Package |
1 |
|
Supplier 3 |
Stage |
1 |
|
Supplier 3 |
Deliver |
2 |
|
Supplier 4 |
Release |
1 |
|
Supplier 4 |
Produce |
1 |
|
Supplier 4 |
Package |
1 |
|
Supplier 4 |
Stage |
1 |
|
Supplier 4 |
Deliver |
2 |
Table 7. Server Capacities at Suppliers
Participant |
Stage |
Capacity (Number of servers) |
|
Manufacturer |
Receive |
1 |
|
Manufacturer |
Verify |
1 |
|
Manufacturer |
Transfer |
1 |
|
Manufacturer |
Release |
4 |
|
Manufacturer |
Produce |
11 |
|
Manufacturer |
Package |
1 |
|
Manufacturer |
Stage |
1 |
|
Manufacturer |
Deliver |
5 |
|
Warehouse |
Receive |
1 |
|
Warehouse |
Verify |
1 |
|
Warehouse |
Transfer |
1 |
|
Warehouse |
Release |
1 |
|
Warehouse |
Package |
1 |
|
Warehouse |
Stage |
1 |
|
Warehouse |
Deliver |
4 |
Table
8. Server Capacities at the Manufacturer and the Warehouse
Participant |
Stage |
Capacity (Number of servers) |
|
Retailer 1 |
Receive |
1 |
|
Retailer 1 |
Verify |
1 |
|
Retailer 1 |
Transfer |
1 |
|
Retailer 1 |
Release |
1 |
|
Retailer 1 |
Package |
1 |
|
Retailer 1 |
Stage |
1 |
|
Retailer 1 |
Deliver |
2 |
|
Retailer 2 |
Receive |
1 |
|
Retailer 2 |
Verify |
1 |
|
Retailer 2 |
Transfer |
1 |
|
Retailer 2 |
Release |
1 |
|
Retailer 2 |
Package |
1 |
|
Retailer 2 |
Stage |
1 |
|
Retailer 2 |
Deliver |
2 |
Table 9. Server Capacities at the Retailers
Lead
Times
We set the lead times based on the pilot runs after the inventory values have been set. Pilot runs are carried out with all the rescheduling periods set at the medium value. The lead times are set based on the cycle times obtained from the pilot runs.
![]()
LT = Lead time
k = Factor of safety to account for variability
CT = Cycle time for the pilot run
For example, Product 3 is a make-to-order product. So when a customer places orders with Retailer 1 for Product 3, the product has to go through the Manufacturer, Warehouse and Retailer 1 before it is delivered to the customer. Therefore, for this product at Retailer 1,
![]()
In the simulation experiments, k has been set at 1.5. Table 10 gives the values for the lead times.
|
Participant |
Product |
Lead Time (Days) |
|
Supplier 1 |
Component 1 |
4 |
|
Supplier 2 |
Component 2 |
4 |
|
Supplier 3 |
Component 3 |
4 |
|
Supplier 4 |
Component 4 |
4 |
|
Manufacturer |
Product 1 |
9 |
|
Manufacturer |
Product 2 |
9 |
|
Manufacturer |
Product 3 |
13 |
|
Warehouse |
Product 1 |
4 |
|
Warehouse |
Product 2 |
4 |
|
Warehouse |
Product 3 |
4 |
|
Retailer 1 |
Product 1 |
5 |
|
Retailer 1 |
Product 2 |
9 |
|
Retailer 1 |
Product 3 |
18 |
|
Retailer 2 |
Product 1 |
6 |
|
Retailer 2 |
Product 2 |
10 |
|
Retailer 2 |
Product 3 |
19 |
Table 10. Lead Times for Participants and Products
Reference
[1]
Silver, E.A., Pyke, F.D., and Peterson R., 1998, Inventory
management and production planning and scheduling, Third edition, John
Wiley and Sons.